#Smalltalk doesn't have a debugger that is written for it. However, it does generate the source code information so you can use other .NET debugger. For example, you can use the DbgCLR program from the .NET SDK. Here is a screenshot of the DbgCLR program debugging the #Smalltalk compiler.
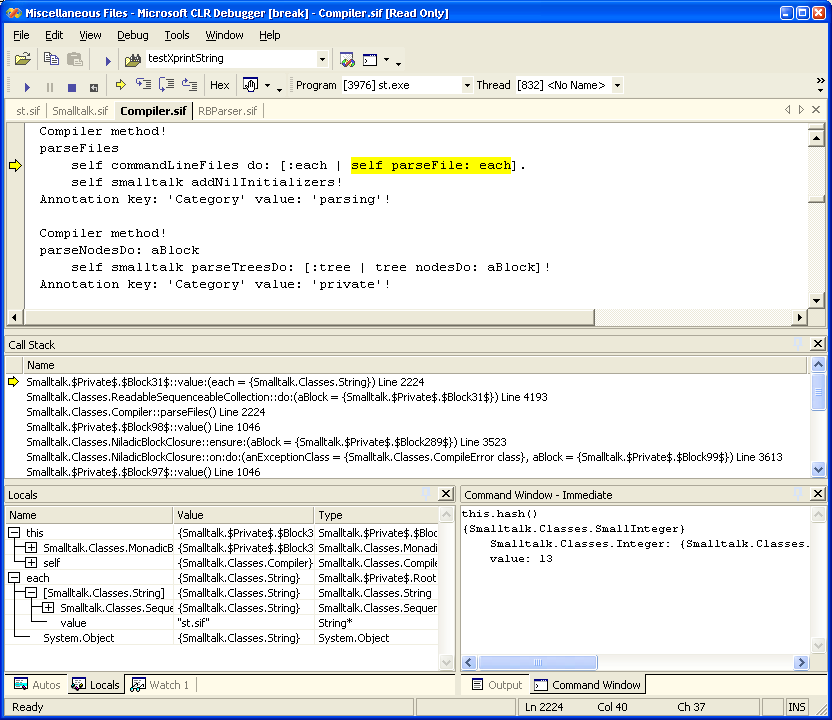
You can use the "Command Window" to evaluate code. However, you must enter the code in C-like syntax. The screenshot shows an example of executing "self hash" (the debugger uses "this" for "self").
Most of the time the debugger should highlight the correct character range. However, if you have a method that contains an explanation point (!), then it will highlight the wrong range after the ! character in the method. This is due to the SIF format.